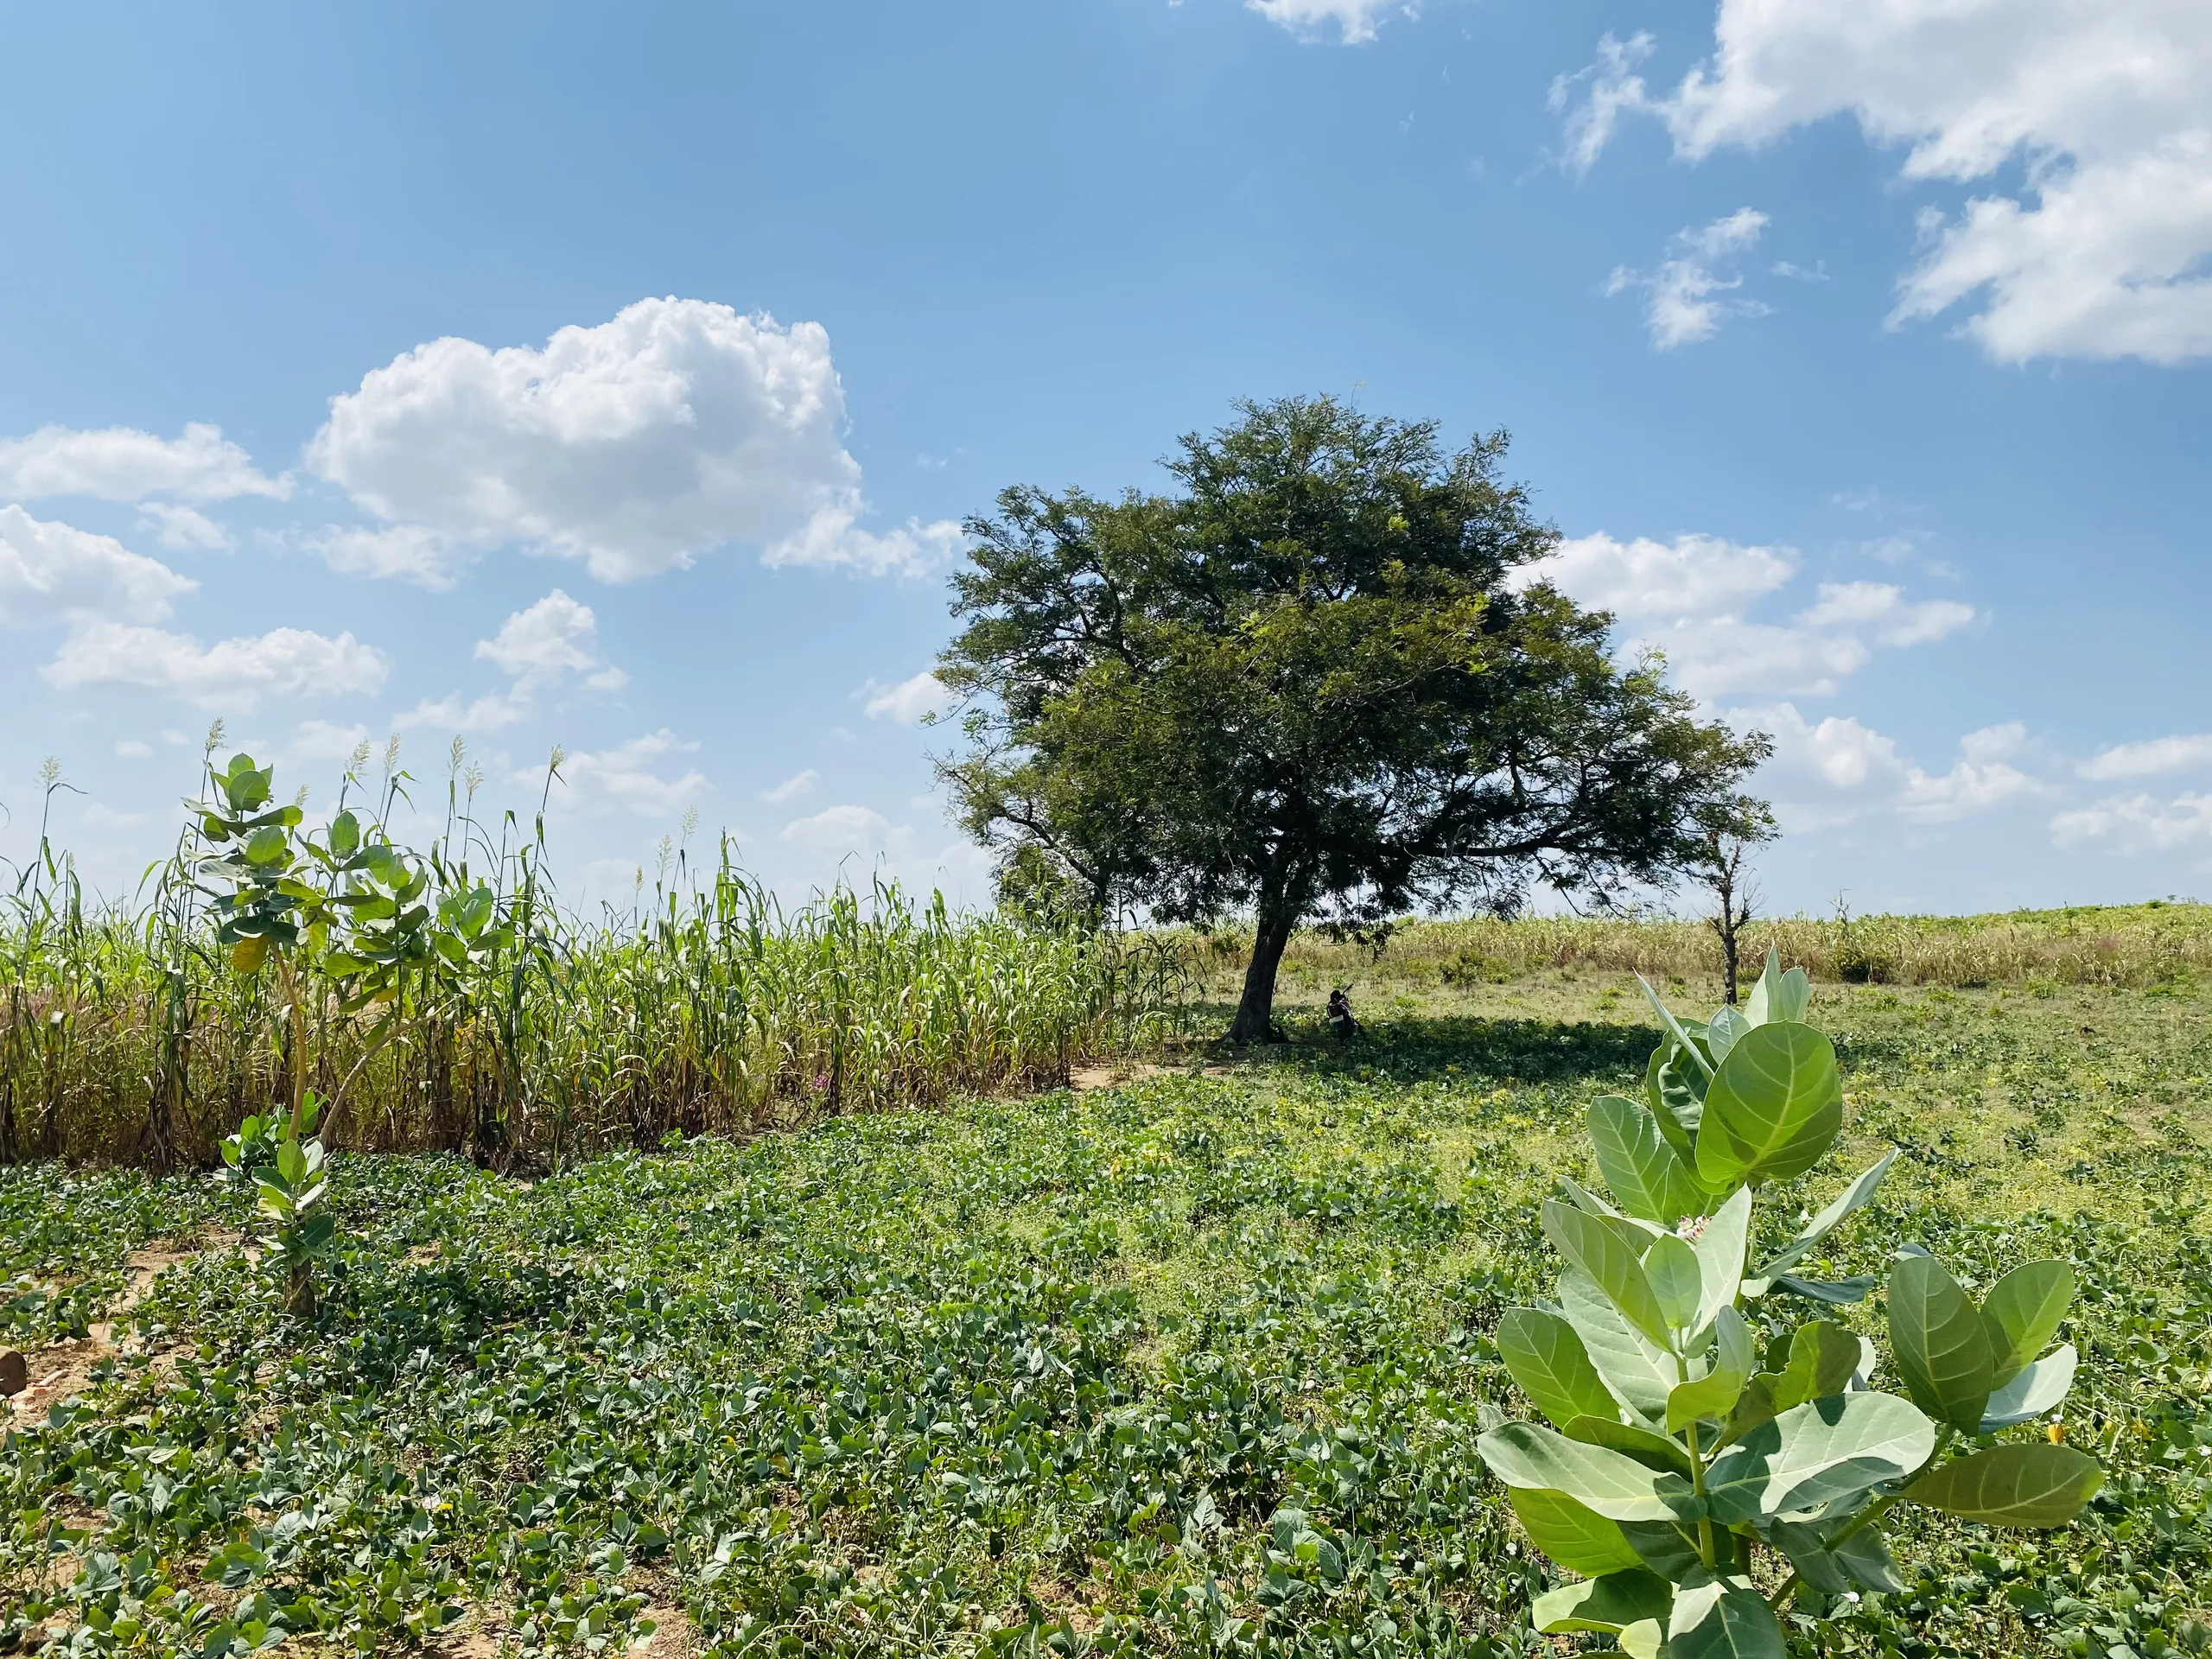

Iwa Sabo Karshi Farmland
Iwa Sabo, Karshi, Nasarawa State, Nigeria. Mapped in the field on Saturday, 14 November 2026.
A 38-hectare block of shrubland and grassland among farmed fields, mapped by handheld GPS. The ground falls about 26 m to the south-east, and a stream line follows the southern boundary.

- Area
- 38.11ha
- 94.18 acres · 381,143 m²
- Perimeter
- 2.94km
- 2,942.82 m around the boundary
- Boundary corners
- 31
- Five tied to GPS fixes
- GPS height
- 269–296m
- Ground falls to the south-east
Boundary plan
The outlined area is the mapped boundary. Tap a corner or a GPS point for its coordinates, or hover a side for its length and bearing. Switch to the 3D view to tilt, rotate and fly around the land.
- Mapped boundary
- Corner drawn on the map
- Corner tied to a GPS fix
- GPS point (P1–P8)
- Centre of the parcel
- Field photos (placed at the nearest GPS point)
- Likely stream line (approximate)
- Mapped road
- Mapped building
The satellite view is the sharpest imagery available for this location, typically 0.3 to 0.6 m per pixel: enough to pick out trees, tracks, field edges and roofs, but not crops. The land cover and greenness overlays are coarser, at 10 m per pixel.
From the field
Thirty photos taken along the eastern side of the parcel during the survey walk, from the north-east corner down to the stream at the south-east corner.
The phone did not record where each photo was taken: all of them carry the same stale position 2.5 km away, which has been discarded. Each photo is instead placed at the GPS point logged closest in time, all within 90 seconds, so positions are approximate. The direction the camera faced is from the phone's compass.
Around P4, north-east side
8 photos · 11:40–11:43 WAT · placed by the time they were taken
Around P6, east side
3 photos · 11:49 WAT · placed by the time they were taken
Around P7, east side
4 photos · 11:50–11:51 WAT · placed by the time they were taken
Around P8, south-east corner (C26)
15 photos · 11:55–11:57 WAT · placed by the time they were taken
Size, shape and location
Size and shape
- Area
- 38.114 ha · 94.18 acres
- Area in square metres
- 381,142.70 m²
- Perimeter
- 2,942.82 m
- Extent east to west
- 1,022 m
- Extent north to south
- 675 m
- Longest straight line across
- 1,026 m (C2 to C27)
- Longest side
- 422.52 m (C1 to C2)
- Shortest side
- 23.28 m (C19 to C20)
The west, north and north-east sides are long straight runs of 238 to 423 m. The southern edge is different: it runs 1.23 km from C2 to C26 in 24 short legs averaging 51 m, the pattern of a line following a feature on the ground. The survey files do not say what it follows, but the terrain model places a stream line along this edge (see Water, roads and buildings).
Area and perimeter stored with the boundary are 381,142.7 m² and 2,942.82 m. Recomputed from the corner coordinates on the WGS 84 ellipsoid they come to the same, so the stored figures check out.
Location
- Centre of the parcel
- 8.753156° N, 7.617180° E
- UTM zone 32N
- 347,892.9 m E · 967,841.3 m N
- Westernmost corner
- C2 · 7.612264° E
- Easternmost corner
- C27 · 7.621557° E
- Northernmost corner
- C31 · 8.755755° N
- Southernmost corner
- C23 · 8.749652° N
- Coordinate system
- WGS 84 (EPSG:4326)
The parcel lies about 38 km south-south-east of central Abuja in a straight line.
Ground heights
GPS height at each fixed point, in metres
Points in the order they were recorded. The bar through each dot is the vertical accuracy the receiver reported.
Six of the eight points carry a GPS height. They range from 295.6 m at the north-west corner (P1) down to 269.4 m at the south-east corner (P8).
That is a fall of 26.2 m over 970 m, an average slope of about 2.7% toward the south-east. The four points along the eastern side sit in between, from 286.9 m down to 280.6 m.
These are heights as the GPS reported them. The file's orthometric height field is empty, so no geoid correction was applied. Use them to compare one point with another, and expect an offset against heights read from a topographic map.
A global terrain model checked at the same six points gives 244 to 268 m above sea level. That is 26 to 28 m lower than the GPS values at every point, with the same pattern and a fall of 24 m from P1 to P8, so the slope is confirmed by an independent source.
Land cover and vegetation
These come from public satellite datasets at 10 m per pixel, not from the survey. Turn on the matching overlay on the map to see where each class sits.
What covered the parcel in 2021
| Class | Share of parcel | Hectares | Share of surroundings |
|---|---|---|---|
| Tree cover | 1.8% | 0.7 | 0.8% |
| Shrubland | 48.8% | 18.6 | 14.1% |
| Grassland | 47.1% | 18.0 | 25.7% |
| Cropland | 2.3% | 0.9 | 58.1% |
| Built-up | – | – | 1.1% |
| Bare or sparse | – | – | 0.3% |
ESA WorldCover 2021. Surroundings means the area around the parcel covered by the map overlay.
In 2021 the parcel was almost entirely shrubland (18.6 ha) and grassland (18.0 ha), with under 1 ha each of cropland and tree cover. No built-up land or open water was classed inside it.
The land around it is different: 58% of the surrounding area was cropland. The parcel stands out as a largely uncultivated block among farmed fields.
The classification is five years old and automatic. It separates broad cover types reliably, but small fields and recent clearing can be missed.
How green the parcel was, wet season against dry season
| Image date | Season | Median greenness | Usual range | Dense green (0.5+) | Sparse or dry (0.2–0.5) | Bare or dry (< 0.2) | Median of surroundings |
|---|---|---|---|---|---|---|---|
| 12 Nov 2026 | End of the rains | 0.50 | 0.32 – 0.66 | 51.6% | 48.1% | 0.3% | 0.57 |
| 2 Mar 2026 | Late dry season | 0.22 | 0.18 – 0.32 | 0.0% | 75.6% | 24.4% | 0.21 |
Greenness is the NDVI index from Sentinel-2 images, where values near 0.1 mean bare soil or dry stubble and values above 0.5 mean dense green vegetation. The November image was taken two days before the survey: about half the parcel was densely green and none of it bare. By March the whole parcel had dried out, with no part reaching 0.5. Nothing inside the boundary stayed green through the dry season, which means the imagery shows no permanently wet ground in the parcel.
Water, roads and buildings
A stream line follows the southern boundary
The terrain model routes a stream along the parcel's southern edge, draining about 32 km² of land upstream. It explains the many short legs on that side of the boundary. Just beyond the south-east corner it joins a larger river.
A larger river passes to the east
A river draining about 128 km² runs north to south past the parcel, about 190 m from the boundary at its closest, east-south-east of the centre. Its tree-lined channel is visible in the satellite view.
No open water shows at 10 m
Neither Sentinel-2 image (12 Nov 2026 and 2 Mar 2026) contains a single open-water pixel in this area, and no river, stream or pond is mapped in OpenStreetMap. The channels are narrower than a pixel and partly under trees, so the images cannot say whether they flow all year. The field photos taken around the south-east corner on the survey day show shallow water running over a sandy bed, so the stream was flowing in mid-November. Check again late in the dry season.
Stream lines are approximate
They are computed from a 30 m terrain model by tracing where water would run downhill. Expect them to sit within about 40 m of the real channel, and less reliably on flat ground where they draw as straight runs.
No mapped road reaches the parcel
OpenStreetMap shows no road, track or footpath inside or touching the boundary. The nearest mapped road is about 425 m to the south. Tracks and footpaths are visible in the satellite view, but nobody has mapped them yet.
The nearest settlement is to the west
432 buildings are mapped in the surrounding area, none of them inside the parcel. The nearest is about 560 m north-west of the boundary, and the main cluster is centred about 1.3 km west of the parcel. It carries no name in OpenStreetMap.
Boundary schedule
All 31 corners in the order they appear in the boundary file, starting at the north-west corner and running anticlockwise. Bearings are true bearings from each corner to the next. Select a corner to find it on the map.
| Corner | Latitude | Longitude | Easting (m) | Northing (m) | Bearing to next | Distance (m) | How it was fixed |
|---|---|---|---|---|---|---|---|
| 8.755589° N | 7.614221° E | 347,568.35 | 968,111.65 | 210° 38′ | 422.52 | GPS fix P1 | |
| 8.752302° N | 7.612264° E | 347,351.78 | 967,748.91 | 122° 20′ | 98.89 | Placed on map (P2, P3) | |
| 8.751824° N | 7.613024° E | 347,435.13 | 967,695.72 | 081° 02′ | 88.51 | Drawn on map | |
| 8.751949° N | 7.613818° E | 347,522.60 | 967,709.17 | 090° 58′ | 95.23 | Drawn on map | |
| 8.751934° N | 7.614684° E | 347,617.80 | 967,707.21 | 084° 14′ | 59.44 | Drawn on map | |
| 8.751988° N | 7.615221° E | 347,676.95 | 967,712.97 | 101° 19′ | 72.69 | Drawn on map | |
| 8.751859° N | 7.615869° E | 347,748.16 | 967,698.45 | 096° 28′ | 57.58 | Drawn on map | |
| 8.751800° N | 7.616389° E | 347,805.35 | 967,691.75 | 129° 53′ | 83.51 | Drawn on map | |
| 8.751316° N | 7.616971° E | 347,869.23 | 967,637.98 | 125° 35′ | 70.30 | Drawn on map | |
| 8.750946° N | 7.617491° E | 347,926.25 | 967,596.87 | 091° 04′ | 55.42 | Drawn on map | |
| 8.750937° N | 7.617995° E | 347,981.65 | 967,595.64 | 035° 25′ | 42.40 | Drawn on map | |
| 8.751250° N | 7.618218° E | 348,006.35 | 967,630.11 | 040° 47′ | 30.55 | Drawn on map | |
| 8.751459° N | 7.618399° E | 348,026.39 | 967,653.16 | 092° 40′ | 39.33 | Drawn on map | |
| 8.751442° N | 7.618756° E | 348,065.66 | 967,651.18 | 089° 40′ | 32.13 | Drawn on map | |
| 8.751444° N | 7.619048° E | 348,097.79 | 967,651.25 | 132° 55′ | 54.20 | Drawn on map | |
| 8.751110° N | 7.619409° E | 348,137.35 | 967,614.20 | 134° 46′ | 57.77 | Drawn on map | |
| 8.750742° N | 7.619782° E | 348,178.22 | 967,573.38 | 156° 47′ | 29.67 | Drawn on map | |
| 8.750496° N | 7.619888° E | 348,189.81 | 967,546.07 | 211° 05′ | 32.44 | Drawn on map | |
| 8.750245° N | 7.619736° E | 348,172.96 | 967,518.35 | 175° 11′ | 23.28 | Drawn on map | |
| 8.750035° N | 7.619754° E | 348,174.83 | 967,495.15 | 100° 13′ | 35.54 | Drawn on map | |
| 8.749978° N | 7.620072° E | 348,209.78 | 967,488.72 | 134° 03′ | 41.01 | Drawn on map | |
| 8.749720° N | 7.620340° E | 348,239.14 | 967,460.10 | 102° 32′ | 34.62 | Drawn on map | |
| 8.749652° N | 7.620647° E | 348,272.90 | 967,452.46 | 072° 55′ | 24.82 | Drawn on map | |
| 8.749718° N | 7.620862° E | 348,296.65 | 967,459.67 | 051° 22′ | 35.23 | Drawn on map | |
| 8.749917° N | 7.621112° E | 348,324.25 | 967,481.55 | 016° 49′ | 37.82 | Drawn on map | |
| 8.750244° N | 7.621212° E | 348,335.32 | 967,517.71 | 014° 45′ | 149.10 | GPS fix P8 | |
| 8.751548° N | 7.621557° E | 348,373.80 | 967,661.74 | 338° 05′ | 84.66 | GPS fix P7, 2.4 m off | |
| 8.752258° N | 7.621270° E | 348,342.49 | 967,740.39 | 286° 20′ | 123.99 | Drawn on map | |
| 8.752573° N | 7.620188° E | 348,223.64 | 967,775.68 | 004° 13′ | 238.03 | GPS fix P5 | |
| 8.754719° N | 7.620347° E | 348,242.02 | 968,012.96 | 287° 22′ | 383.75 | GPS fix P4, 5.3 m off | |
| 8.755755° N | 7.617019° E | 347,876.23 | 968,128.86 | 266° 35′ | 308.40 | Drawn on map | |
| Perimeter | 2,942.82 | ||||||
Eastings and northings are UTM zone 32N (EPSG:32632) on WGS 84. Distances are geodesic.
GPS points
Eight points were logged between 11:20 and 11:56 West Africa Time, 35 minutes 35 seconds from first to last. Six are GPS fixes with a reported horizontal accuracy of ±3.79 m. Two were placed by hand on the map.
| Point | Time | Latitude | Longitude | Height (m) | Accuracy H / V (m) | Heading | Fix | Remark in file | Against the boundary |
|---|---|---|---|---|---|---|---|---|---|
| 11:20:30 | 8.755590° N | 7.614221° E | 295.6 | 3.79 / 2.5 | 191° | GPS fix | – | At corner C1 | |
| 11:29:11 | 8.752302° N | 7.612264° E | – | – | – | Placed on map | – | At corner C2 | |
| 11:29:17 | 8.752302° N | 7.612264° E | – | – | – | Placed on map | – | At corner C2 | |
| 11:41:54 | 8.754767° N | 7.620348° E | 286.7 | 3.79 / 2.5 | 277° | GPS fix | – | 5.3 m from C30 | |
| 11:47:29 | 8.752573° N | 7.620188° E | 284.8 | 3.79 / 2.5 | 111° | GPS fix | boundary | At corner C29 | |
| 11:47:55 | 8.752459° N | 7.620211° E | 286.9 | 3.79 / 3.2 | 100° | GPS fix | boundary | 11.4 m inside the line | |
| 11:52:08 | 8.751570° N | 7.621553° E | 280.6 | 3.79 / 2.5 | 154° | GPS fix | boundary | 2.4 m from C27 | |
| 11:56:05 | 8.750244° N | 7.621212° E | 269.4 | 3.79 / 2.5 | 261° | GPS fix | – | At corner C26 |
Heading is the compass direction the device reported when the point was saved.
Before relying on these figures
This is a handheld GPS mapping, useful for planning and for describing the land. It is not a registered cadastral survey.
Most corners were drawn, not occupied
Five corners match a GPS fix (C1, C26, C27, C29, C30) and C2 matches the two hand-placed points. The other 25 have no GPS height and no matching point, which suggests they were traced on screen. That covers the whole southern edge.
The area carries about ±3%
With ±3.79 m on each fix, moving the whole 2,943 m boundary in or out by that much changes the area by about 1.1 ha. Treat 38.1 ha as 37 to 39 ha until corners are pegged.
P6 is tagged "boundary" but sits off the line
P6 was saved 26 seconds after P5 and lies 12.9 m south of it, 11.4 m inside the drawn boundary. It is not a corner of the polygon. Confirm on site which of the two marks the true corner.
P4 and corner C30 differ by 5.3 m
C30 carries P4's height (286.7 m) but sits 5.3 m south of where P4 was fixed. P7 and C27 differ by 2.4 m. Both gaps are within or near GPS accuracy, but the corners were not snapped exactly to the fixes.
P2 and P3 are the same spot
Both were saved six seconds apart at the south-west corner (C2) with no GPS fix, no height and no accuracy value. They are map taps, so that corner's position depends on the background imagery used.
Heights are relative
No geoid model was applied and each height carries ±2.5 m or more. The 26 m fall across the parcel is well beyond that error, so the direction of slope is reliable; individual values are approximate.
Survey files and sources
Files from the field
- Iwa Sabo Karshi Farmland.gpkgGeoPackage with two layers. Boundary: one polygon with stored area and perimeter. Layer1: eight points with time, height, fix type, accuracy, speed and heading. Written 14 Nov 2026 at 17:00 WAT.52.0 KB
- Iwa Sabo Karshi Farmland.gpkg-journalSQLite journal left beside the GeoPackage. Keep it in the same folder as the .gpkg.16.5 KB
- Iwa Sabo Karshi Farmland.zipThe two GeoJSON files, zipped.1.1 KB
- Iwa_Sabo_Karshi_Farmland_Boundary.geojsonThe boundary polygon with NAME, AREA, PERIMETER and REMARKS.1.2 KB
- Iwa_Sabo_Karshi_Farmland_Layer1.geojsonThe eight points with their REMARKS only. Time and accuracy are in the GeoPackage.1.0 KB
Outside data added to the survey
- Satellite view
- Esri World Imagery (Maxar), about 0.6 m per pixel, loaded live.
- Sentinel-2 image
- Copernicus Sentinel-2 scene of 12 Nov 2026, 10 m per pixel.
- Greenness
- NDVI computed from the Sentinel-2 scenes of 12 Nov 2026 and 2 Mar 2026. Both were cloud-free over the parcel.
- Land cover
- ESA WorldCover 2021, version 200, 10 m per pixel.
- Stream lines, 3D terrain
- AWS Terrain Tiles, built on the 30 m SRTM terrain model.
- Roads and buildings
- OpenStreetMap contributors, as mapped on 16 Nov 2026.
The boundary, corners, GPS points and heights come from the survey files. Derived values (bearings, distances, UTM coordinates, slope) were computed from the recorded coordinates on the WGS 84 ellipsoid. Everything listed as outside data is public information added for context and is not part of the survey.